
- Home prices forecast to rise 5.2 percent over the next year.
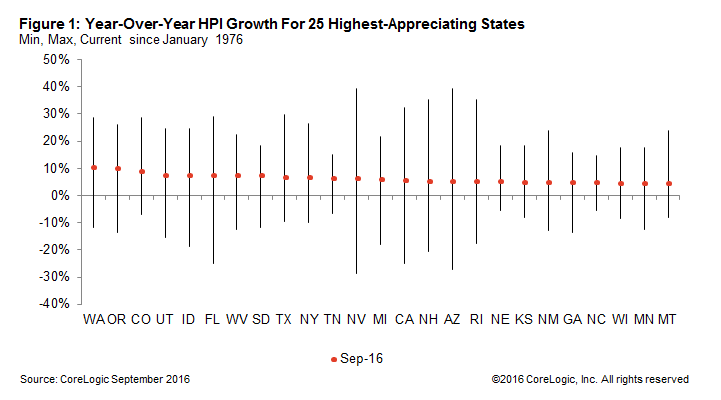
- The highest appreciation was in the West, with Oregon and Washington growing by double digits in September.
- After adjusting for inflation, home prices are still 19.1 percent below their peak.
National home prices increased 6.3 percent year over year in September 2016. While the HPI has increased on a year-over-year basis every month since February 2012, prices are still 5.2 percent below the April 2006 peak. Home prices have risen 43 percent since bottoming out in March 2011. Home prices are expected to increase by 5.2 percent from September 2016 to September 2017, and are projected to return to the April 2006 peak in mid-2017. Adjusting for inflation, U.S. home prices increased 5.8 percent year over year in September 2016, and are 19.1 percent below their peak(1).

Figure 1 shows the year-over-year HPI growth for the 25 highest-appreciating states in September 2016 along with their highest and lowest historical price changes. Washington showed the largest HPI gain of all states in September 2016 with a 10.3 percent year-over-year increase, followed closely by Oregon (+10.1 percent). Nevada home prices were the farthest below their all-time HPI high, still 31.4 percent below the March 2006 peak.

In addition to the overall indices, four individual home-price tiers were calculated relative to the median national home price(2). Figure 2 shows the levels of the four price tiers indexed to January 2006, shortly before each of the tiers hit its peak index value. The low-price tier has shown the most price growth in recent months, increasing 8.8 percent year over year in September 2016. This price tier also recovered 60.4 percent from its lowest point in March 2011 and is the only price tier to pass its pre-housing-crisis peak. Although the low-to-middle tier has recovered 51.1 percent from its lowest point in March 2011, and grew 7.6 percent year over year, it is still the farthest from its peak of all the price tiers, down 6.6 percent. The middle- to moderate-price tier increased 6.6 percent year over year in September 2016, but remains 6.4 percent below its peak. The high-price tier, which fell the least during the housing crisis, increased by 5 percent year over year in September 2016, the slowest increase of all the price tiers. The high-price tier remains 4.8 percent below its peak.
(1)The Consumer Price Index (CPI) Less Shelter was used to create the inflation-adjusted HPI.
(2)The four price tiers are based on the median sale price and are as follows: homes priced at 75 percent or less of the median (low price), homes priced between 75 and 100 percent of the median (low-to-middle price), homes priced between 100 and 125 percent of the median (middle-to-moderate price) and homes priced greater than 125 percent of the median (high price).
Leave a Reply
You must be logged in to post a comment.